Last Updated on November 7, 2024 by Owen McGab Enaohwo
Life was more straightforward in the pre-internet years. All positions in a company were well defined, with everyone knowing exactly what they were expected to do. The organizational charts of the time were easy to draw and interpret since they reflected a top-down hierarchy.
But the advent of the internet shook things up in the corporate world big time. All of a sudden, companies realized the rigid approach they were accustomed to was holding them back. Their nimbler competitors quickly reorganized themselves to shifting market demands and reaped tremendous rewards.
Today, work methodologies such as scrum, agile, BYOD, and remote working, require a horizontal organizational structure that is constantly evolving. Keeping a neat organizational chart handy becomes an issue when all employees wear different hats throughout their tenure.
But this is precisely why organizational charts are so important today. Without a well-thought-out tool that helps everyone understand their roles and responsibilities, people may overstep their boundaries or discharge their duties inefficiently. The challenge, however, is that the organizational chart also needs to adapt as the company morphs.
Here’s all you need to know about organizational charts, where they came from, how they work and how you can use them to help you take your business to the next level.
Full Guide to Organizational Charts – Chapter Index
Chapter 1: History of Organizational Charts
Chapter 2: Types of Organizational Charts
Chapter 3: How to Draw a Basic Organizational Chart
Chapter 4: All You Need to Know About Organizational Charts and How to Use Them
History of Organizational Charts

In some ways, organizational charts are as old as humanity itself (kind of). A family tree is very much a basic organizational chart, even if it doesn’t illustrate responsibilities.
But for all intents and purposes, the chart we all know appeared in the mid-1800s during the Industrial Revolution. Setting up and organizing factories was a heck of a lot more stressful on management than feudal agriculture ever was.
Nowhere was this more evident while setting up rail tracks to ferry raw materials and finished goods to and from said factories. The Erie Railroad Company was particularly disorganized in its projects mainly because, unlike its competitors, it had 500 miles worth of rail tracks to its credit.
This problem became all too evident to General Daniel McCallum when he became superintendent of one of the stations. An engineer and an architect, the Civil War veteran is credited with designing a type of covered truss bridge that could accommodate heavier loads. His design is still in use today.
Upon being promoted to general superintendent, McCallum had over 5,000 employees answering to him. One of his more immediate problems was the high cost of moving materials on the expansive Erie network relative to their smaller competitors.
McCallum postulated that the problem was born out of management practices that were unsuited to the large scale on which Erie Railroad was operating. In his 1856 report to the company stockholders, he explained that a manager with 500 miles of railway tracks to manage would face a very different set of challenges than a manager who only has 50 miles to oversee.
Consequently, he set about creating a new set of rules to streamline rail route management. His management was based on six principles:
- A well-defined structure of responsibilities.
- Strategic and sufficient assignment of power to managers so that they may dispose of their duties.
- A method of tracking if duties are carried out on time or not.
- An emphasis on reporting any breakdown of discipline or dereliction of duty so that it may be immediately corrected.
- A method of obtaining reports that will neither diminish nor overpower managers down the value chain.
- A method for helping managers identify both errors and delinquents.
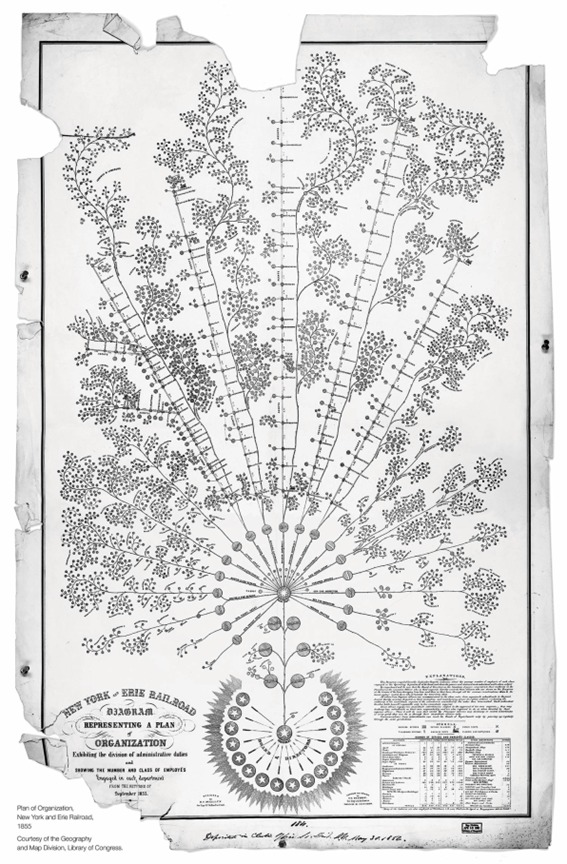
He furthermore created positions for eight officers who’d answer directly to him. McCallum also laid out an extensive organizational chart that clearly illustrated who would report to whom.
Unlike the charts we see today, McCallum’s creation looked like a plant growing out, primarily due to the complex nature of his operations.
His methods proved highly effective as the Erie company saw massive reductions in waste and greater profits, and other companies readily adopted them.
While McCallum’s chart was adequate, its organic layout wasn’t something that could be readily ported to the corporate world. And so, the next iteration of the organizational chart came in 1917 when Herman Hollerith of the Computing-Tabulating-Recording (CTR) Company came up with a more structured illustration of his organization.
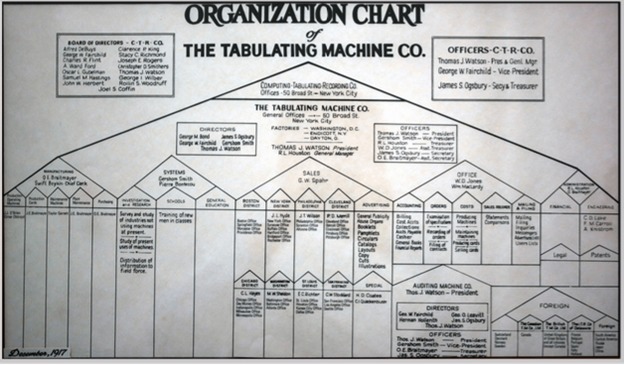
The chart and its ensuing utilization helped the company perform better and more efficiently. The CTR company was rebranded as International Business Machines (IBM) in 1924.
IBM’s design became popular over time and is now the basis for all organizational charts in use today. While the hierarchical top-down structure remains essentially unchanged, companies usually become creative with titles and responsibilities.
The incredible flexibility of modern business requires organizations to change their structures and member responsibilities fast. Many companies, particularly those who like working remotely or using working systems like BYOD and agile, are shifting to a holarchy model where roles often overlap and responsibilities aren’t perfectly defined. Such new trends present unprecedented challenges where organizational charts will become even more relevant than ever before.
Types of Organizational Charts
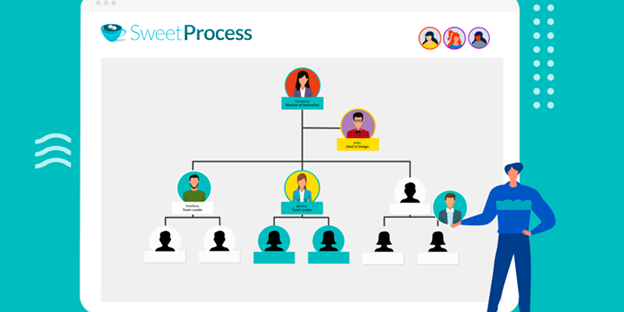
Organizational charts have evolved over the years since their introduction. Depending on your requirements, you can choose from four different types of charts:
1. Hierarchical organizational charts
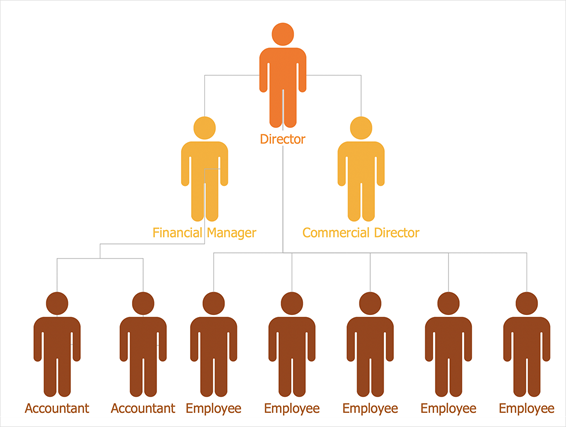
These are basically the same as what IBM came up with and follow a simple pyramid-shaped structure with power flowing downstream. Hierarchical charts illustrate a simple division of labor with the person who has the most decision-making power sitting on top.
So, an organization following a hierarchical structure typically will have the CEO, director, or general manager at the top, who oversees all the company departments. Each department will have managers who have teams of employees reporting directly to them.
In many ways, hierarchical structures form the basis of all organizational charts since any organization will have a leader with several people reporting directly to them.
2. Matrix Organizational Charts:
While very effective for simple organizations, hierarchical structures quickly become ill-suited to large-scale projects that require cross-department collaboration.
The limitations of simple hierarchies were observed during the latter half of the 20th century in the aviation sector, where incredibly complex engineering problems needed solutions. Even though sharing information and experience across departments became important, companies couldn’t afford to lose the sense of hierarchy that allowed them to function correctly.
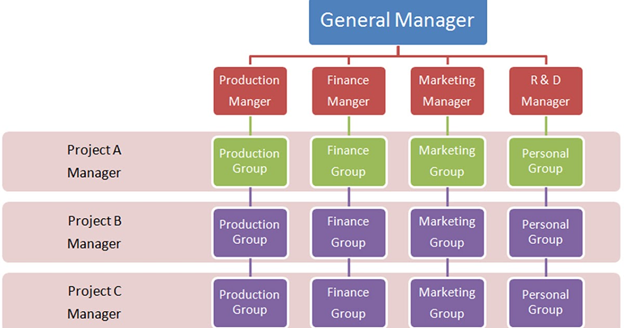
Matrix organizational structures, therefore, added a second, horizontal delegation of responsibilities to the hierarchical structure. In a matrix-type structure, an employee can answer to more than one manager.
Besides the traditional hierarchical roles such as marketing, sales, HR, and finance, special project managers are also thrown into the mix here who operate horizontally. So, while a marketing manager will only have a marketing team under him, a project manager’s team can consist of people from marketing, sales, and finance if need be.
Matrix structures allow companies to operate more dynamically as special teams under project managers can be created on demand to tackle specific problems. The agile methodology also owes its origins to the matrix organizational structure.
3. Divisional Organizational Chart:
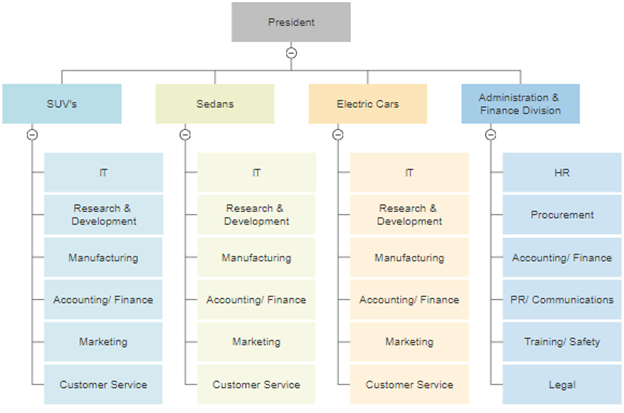
Once a company becomes large enough, a simple hierarchical or matrix-like structure will no longer suffice to help it operate efficiently. It may have groups of specialized products or interests, or it will have spread out to different geographical areas, which will require specific organization. Companies also set up R&D divisions to research new products or improve existing ones.
A division-based structure can be used in cases where each division has its own hierarchical or matrix-based organization. For example, Apple has different divisions for smartphones, desktop computers, laptops, and software, all of which will have their own organizational structures. The company will also have separate divisions for each country it sells its products in.
4. Flat Organizational Charts:
The traditional structures mentioned above were designed around rigid structures with authority taking central place. But enterprises in the dot-com era quickly realized rigidity could get in the way of creativity and problem-solving. The more bosses an employee needs to report to, the more time it takes to reach a consensus.
Unlike hierarchical and matrix structures, a flat organization puts employees at the center. The emphasis in a flat organization is to remove red tape caused by excessive management and enable employees to make decisions with minimum approval.
In this sense, a flat structure may also be considered “hierarchical lite” since the fundamental premise remains the same, but with as few management levels as possible. An employee here can report directly to a CEO if needed. Flat organizational charts are highly relevant for IT, remote, and modern cloud computing enterprises that require a very high level of flexibility.
The most famous example of a flat organization chart is that of the video game company Valve. Even though the company has a CEO—its owner Gabe Newell—there are no fixed management positions nor any permanent teams.
Teams are created and disbanded based on project requirements, and Newell has stated he tries not to interfere with a team’s day-to-day work. This type of organizational structure is sometimes called a holarchy with no defined structures, and associations are based on symbiotic relationships.
Even though each charting system may seem relevant, you may find yourself getting quickly overwhelmed with a plethora of choices as you begin. Let’s take a look at how you can make an organizational chart right for your company.
How to Draw a Basic Organizational Chart
While seemingly straightforward, putting an organizational chart together can quickly become an ordeal if attempted in an unplanned, piece-meal manner. Much like the structure it is supposed to represent, the charting process needs decisive planning as well.
Here are a few ideas to help you out:
Start by Picking an Organizational Structure
All types of structures have their merits. But they also have several drawbacks you should be aware of.
Hierarchical structure:
The simplest of the four, hierarchical structure is ideal for companies just starting and those in their post-startup phase.
Pros:
- The accessible format makes charting simple to understand and modify.
- Reporting and promotion structures are well-defined.
Cons:
- Prone to bureaucratism and red tape as the organization grows.
- A simple structure may lead to one-dimensional thinking and decision-making.
- Ill-suited to modern, employee-centric companies.
Matrix structure:
Matrix structure is already popular with IT enterprises and several older, well-established companies since it allows for robust hierarchies while allowing reasonable freedom.
Pros:
- Department managers retain their traditional power structure.
- Project managers allow for time-specific skills to be added and subtracted on-demand.
- Cross-departmental mobility is easier to manage than in a hierarchical structure.
Cons:
- Answering to multiple managers can make reporting difficult.
- Conflict might arise between project and department managers.
Flat structure:
The flat structure has only taken off more recently as hyper-competition and modern market dynamics require companies to make faster decisions.
Many startups opt for a flat structure to speed up decision-making and product development and attract high-quality talent.
Pros:
- Fewer management layers mean teams can be created and reassigned far faster than any other structure might permit.
- Holarchical models are ideal for BYOD, remote working, agile, and telecommuting work styles.
Cons:
- It can quickly result in confusion if roles and responsibilities aren’t well defined.
- The organic nature of a flat structure may result in people overstepping their boundaries.
Get Your People in on It
While it’s easy to take a stock template and populate it with positions and names, an organizational chart presents more opportunities than many managers realize.
Getting everyone involved here will allow you to discover new ways of structuring your organization. It may even reveal new (or fewer) positions that may drive up efficiency.
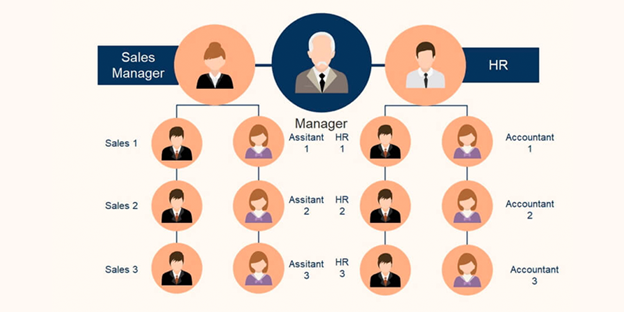
So, while you may think of a simple top-down diagram on Word to illustrate how your company looks, your team may come up with something like this:
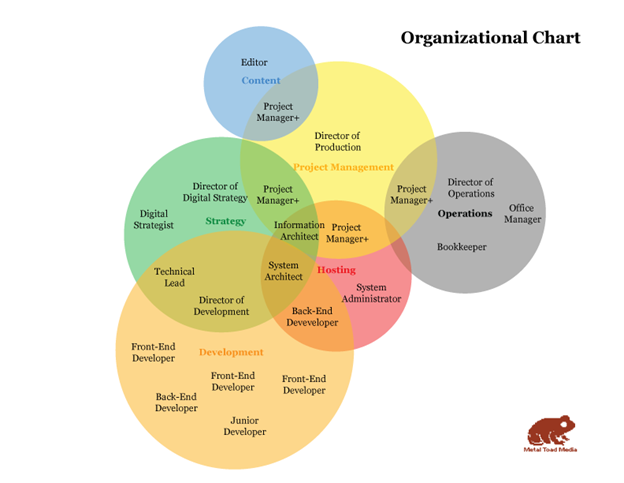
Employees will also appreciate the fact that their input went into how the company was structured.
Collect Relevant Data
You will need the following data to create an organizational chart:
- Departments
- Positions
- Unique identifiers
- Phone numbers
- Emails
- Who reports to whom
Data can be collated in several ways, including:
- Comma-delimited text files
- MS Excel spreadsheet
- Google spreadsheet
- MS Exchange server directory
Having permanent data sources will allow you to make changes to your organizational chart with minimal effort. Comma-delimited files are handy if you plan on using MS Word to craft your organizational chart since the software has built-in features that can create a chart simply by importing the text file.
Create the First Draft of Your Chart
For this illustration, we will be using the Chart feature in Google Sheets since the software is free and, being cloud-based, can be accessed anywhere. Follow these steps:
- Go to your Google Drive and open a Sheet.
- Add “Employee Name” in the first column.
- Add “Manager Name” in the second column.
- Populate the first column with the names of all employees.
- Enter the names of the manager against each employee in the second column.
- Select both columns.
- Now, go to Insert > Chart and click Chart Type and select “Organizational chart.”
- You should see a chart appear in your spreadsheet.
As effective as this chart can be, the modern business demands require far more advanced features than a simple charting solution such as Google Sheets can provide. In the following section, we will detail five such software that can help you do just that.
Tools to Help You Create and Manage Your Organizational Chart

Even though business organizational charts remain highly relevant, they need to keep up with the times. As modern enterprises often have to pivot on a penny, a company structure chart relevant yesterday may be useless today.
You can always redraw charts or create them to account for frequent changes; however, specialized cloud-based tools can enable you to manage your charts so that your company’s structure can be remapped based on current demand or circumstances. It can also alert all stakeholders to the changes made and then reinstated once the challenges have been successfully resolved.
Since such initiatives will generate a wealth of data, the tools can record all the changes for future reference. Let’s take a look at some of the best organizational charting tools currently available and what all features they offer:
Organimi
Features: Built for organizational charts from scratch, drag-and-drop chart builder, unique iconography and layouts, photo boards, private and public charts, smart charts
Price: Starts at $10/month
Free trial: 14 days
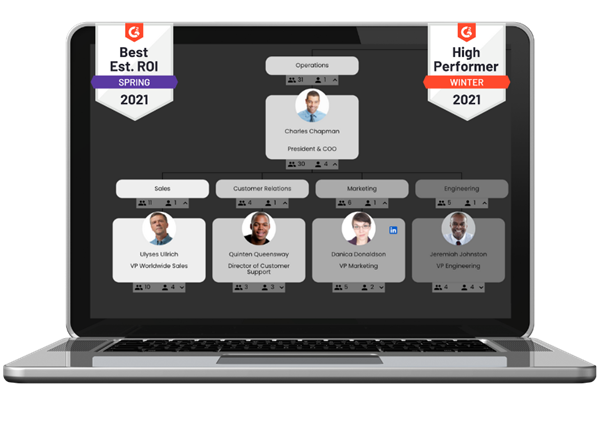
Most of the other features on our list are essentially cloud-based management tools that can also create organizational charts; Organimi is built exclusively for designing and implementing them.
Organimi accepts inputs from most HRMIS systems out of the box. So you can use CVS or text files with company and employee data that you’d like to use for creating a chart in Organimi instead of manually adding it in.
You can also just have Organimi’s concierge service create an attractive, easy-to-follow organizational chart for you instead of doing it all yourself. The concierge service allows for a more hands-off approach to your charting needs and can do the following:
- Import data and photos from your database.
- Build staff rosters and specialized team maps.
- Create custom fields specific to your organization.
- Basically, do anything else that the tool offers.
Organimi’s simple UI, coupled with advanced features, makes it a no-brainer for most companies looking for an organizational charting tool. Given the free version, you’re strongly encouraged to check it out.
Lucidchart
Features: Collaborative diagramming, data-in-context, integrates with almost every popular app, easy to scale your charts as your company grows
Price: Starts at $7.95/month
Free trial: Yes
Organizational charts rarely sit in isolated silos. They usually require additional diagrams to make sense. This is where Lucidchart comes in handy.
The cloud-based program is essentially a flow-charting solution. However, since even organizational charts are a kind of flowchart, they can quickly be drawn here.
If you’ve ever used MS Paint or Apple Draw, then you’ll have no problems with Lucidchart. That’s not to say people unfamiliar with diagraming or photo-editing software are at a disadvantage. Lucidchart has an incredibly user-friendly interface and drag-and-drop design.
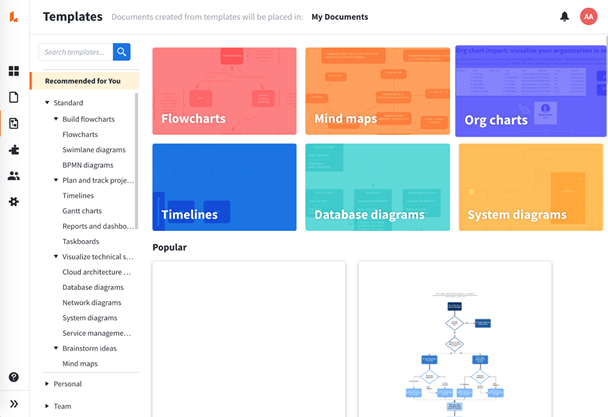
After setting up an account, you can either start with a blank document or use any of the pre-designed templates.
Easily the most helpful feature that Lucidchart offers is its collaborative design feature. Think of it as the comments section in a Google Doc. You can tag specific people onto specific boxes on a chart.
Lucidchart lacks the concierge feature of Organimi, but it more than makes up for it with its incredible across-the-board integration. You can import and export files from Google Drive, MS Teams, Word, Slack, Salesforce, etc.
Even though organization charting is just one of many different diagrams Lucidchart is capable of, the team behind it has given it plenty of thought.
Not only do they have a massive number of templates of all kinds of organizational charts, but they also show you how to create them through educational blog posts.
SmartDraw
Features: Largest library of charting templates and symbols, CAD-like drawing abilities, custom SDK, great collaboration ability
Price: Starts at $9.95/month for a single user
Free trial: Yes
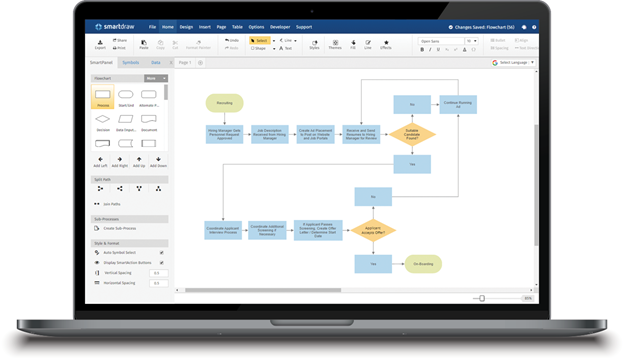
SmartDraw is the oldest and by far the most well-thought-out of all the diagramming tools available today. The project started as an attempt to make complex visualizations possible in tools like Visio with the simplicity of drag-and-drop software like MS Word, a goal that SmartDraw has achieved.
Once you’ve signed up, one thing becomes clear about SmartDraw: it’s not geared toward any one type of user in particular. Whether you’re an academic, freelancer, business owner, or government employee, SmartDraw will have a template, a set of symbols, and rules to help you out.
SmartDraw is available both through the website and as a downloadable tool. It comes with a seven-day free trial offer with all the features unlocked, and given the immense number of features, it’s prudent to try it out.
Like Organimi, SmartDraw lets you upload your data through CSV files and Azure Active directories. The software can automatically draw a basic organizational chart with the imported data.
Even though making and managing organizational charts in SmartDraw is easy, it still isn’t as sophisticated as Organimi. The charts are simple hierarchical illustrations for the most part. Where SmartDraw shines is in chart management, online sharing, and updating.
The Org
Features: Easiest to learn, public charts allow for comparison and marketing
Price: Free
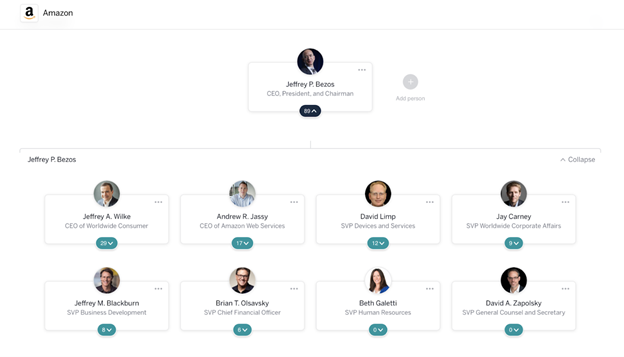
The Org is all about transparency. So much so that you can create your organizational charts, publish them online, and even compare them with other companies’ charts (kind of like pitting your Facebook profile against a friend’s).
The Org’s advantage isn’t its massive feature set—there is none. All you get is a simple drag-and-drop tool that lets you create a basic organizational chart. Rather, what makes The Org stand out is its ability to make your chart discoverable.
Company culture is a key point for modern millennial and Gen Z workforce when choosing where to work. Even though social media presence and general word of mouth’s all good, nothing gets the point across like seeing the company structure. It reveals key insights into how the company works and what a new employee can expect after joining.
The Org is already used by companies like Google, Tesla, and Apple and is fast becoming a favorite amongst startups. Given that it’s free and allows you to market your brand, we’d say it’s worth a look.
SweetProcess
Features: Document processes, procedures and policies. Steps can be added to each as checklists and can include videos and pictures. Enables training on the job.
Price: $99/month for up to 20 members plus $5/month for every additional user
Free trial: 14 days; no credit card required
SweetProcess is a process, procedure, and policy documentation tool that lets you break down your tasks into easy-to-manage checklists which can be assigned to all members of a team.
SweetProcess targets a particular problem in the management landscape—companies often struggle to turn their policies into procedures and procedures into processes. There’s a lot of unsaid personal and tribal knowledge that only certain people know, and that knowledge is lost the moment they leave the company.
SweetProcess allows an organization to record process-based knowledge in both its formal and implicit forms. Tasks in SweetProcess can be managed against:
- Policies: General guidelines that indicate what an organization’s core beliefs and goals are.
- Procedures: The official way of doing things.
- Processes: The series of steps required to complete a task.
So, policies are related to the organization’s goals. The procedure is essentially a map of achieving those goals, and processes are the steps needed to complete each task in a procedure.
In SweetProcess, you can have checklists and tasks for all three. Managers can assign a policy, procedure or process to an employee and keep track of how all the work in their authority scope is proceeding through the interactive dashboard.
Some Things to Keep in Mind When Creating an Organizational Chart
The problem with organizational charts isn’t the charting itself. Rather, it’s figuring out a structure that can help your company achieve its goals most efficiently. A disorganized company structure with many management tiers and positions will make for a poor, hard-to-read chart.
In other words, you need to understand your business’s goals, strengths, and weaknesses before you can put an organizational diagram together. Here are a few ideas to get you started:
What Goal Are You Trying to Achieve?
Is your company a new one? Or is it an established company trying to pivot to a new direction? Having clearly defined goals will help you draw out a more efficient organizational structure and chart.
Since we’re talking about organizational goals here, your best bet is to really understand who you’re selling to. As Matthew Odgers, founder and CEO of Odgers Law Group, said, “The whole reason for an organization’s existence is to make life less difficult for its customers.”
This is also just about the hardest thing to do. Most businesses fail because there’s no market demand for their products. All of us tend to believe that everyone wants the same thing that we do when, in reality, different people have different goals. Getting to know your customers as well as you can, what they do, their fears, hopes, and dreams can help you create more realistic goals.
Consider Lessons from the Past
If your company has some years under its belt, then consider what worked and what didn’t. Did you achieve certain goals better than others? Are some departments not working to their full potential? Were there reporting issues that were taking too long to resolve? Was there unnecessary rivalry between different sections of the company?
Lessons from your past can help you create a more refined organizational chart. Consider keeping a list of issues you faced while crafting or refining your company structure.
Create a Basic Organizational Structure
You can start with the departments that your company needs. All companies need administration, financial, operations, human resources, and sales/marketing departments.
What varies significantly from one organization to another is the emphasis on departments. For example, a digital marketing firm will have a more refined marketing department since it has the most experience.
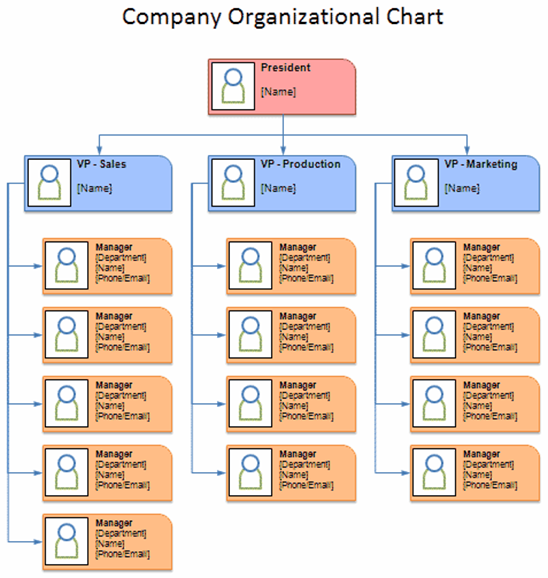
This is what a basic organizational chart will look like:
Balance Authority with Responsibility
The authority responsibility equation is by far the trickiest part of any organizational structure. Too much authority usually results in an overbearing attitude and stifled creativity, while too little means an insufficient command to get results.
Likewise, too much responsibility can result in frequent burnouts. But assign someone too few responsibilities, and you’re leaving money on the table.
The key issue here is knowing which tasks to delegate to which organizational level and also how to delegate them. This is where getting your employees involved in the decision-making process becomes essential.
Says Harvard Business School Professor Kevin Sharer in the Online Management Essentials course: “You’ve got to have real clarity of objective. That includes having alignment on what does good look like” and by what timeline, and “the technique of measuring accomplishment.”
Before anyone starts working on a project, they should know what they need to complete and by when, including the metrics you’ll use to measure the success of their work.
SweetProcess can help you break all the tasks down to their smallest components, which can create an authority structure. Simply put, both the managers and their team members can be assigned individualized checklists. The manager will have complete visibility and control over all the checklists that fall under their scope.
Why SweetProcess is Ideal for any Organizational Charting Task
While all the tools discussed above are great for visually representing your company structure, they really cannot get into the minutiae of each layer. For example, what precise processes does a marketing manager need to follow? Can they be listed out in a simple set of instructions?
SweetProcess isn’t a charting solution per se. But, as we discussed in the section on how to draw an organizational chart, the quality of your charts depends on the quality of the data behind them.
In other words, you need to understand what the policies, procedures and processes will be that will enable your company structure to operate. In the absence of process information, organizational charts are merely theoretical diagrams that depict how things ought to work.
Being a process documentation suite, SweetProcess can help you here in three ways:
Keep a Repository of All Your Process Knowledge
With SweetProcess, you can easily create a set of instructions for each layer in your organizational chart that your teams can follow. Processes can be turned into to-do lists which can be issued, tracked, and updated in-app.
For example, even though Zen Media was consistently achieving excellent results for their clients, their CMO, Stephanie Chavez, discovered the company’s processes were all over the place.
Employees often had to sift through massive databases, emails, or even ask around for relevant information, adding hundreds of hours of irrelevant work.
With SweetProcess, Stephanie was able to create a more streamlined employee onboarding process and a centralized knowledge base for all the teams. Having all relevant information neatly categorized into processes and procedures means that their tasks can be completed by their peers even if an employee isn’t available.
Use Your Organizational Knowledge to Create Realistic Organizational Structures
The idea behind a process knowledge base is to create realistic operational structures within a company to enable higher efficiency. Jennifer Imion, director of operations at Mavin Records, certainly believes in documenting operational procedures, particularly the repetitive ones.
As a company that thrives on discovering new talent, Mavin Records needed a set way of doing things to counterbalance the unique requirements each new artist will have. New artists would often introduce their cousins as managers and require unique equipment that the company had to provide, creating fresh operational challenges.
With SweetProcess, Mavin created a robust foundation upon which all new artists can be managed. The company has content, PR, and management teams that do all the heavy lifting for the artists.
With the help of SweetProcess, the company has created highly structured systems to manage its creative endeavors, and its success shows.
Foster Better Communication Between Teams and Team Members
Almost any organizational problems can be traced back to poor communications. It may even be argued that the purpose of a sound organizational chart is to facilitate better communications throughout the chain of command.
This message was key in Dr. Jeremy Weisz’s interview with Mike Fiorenza, COO at Bundren Paintings. The company specializes in large-scale painting projects and consequently required a refined organizational structure.
Fiorenza realized the importance of time blocking for meetings as many issues needed one-on-one consultations. He also emphasized a reporting structure that can save time as often team meetings would spiral into hour-long discussions that got nowhere.
If you’d like to see just how much SweetProcess can do for your organization, check out our 14-day free trial; no credit card required!
Conclusion
Organizational charts remain an integral part of any modern company, even if they may seem like a formality at first glance. More than simple illustrations that show who reports to whom, these charts show the relationships they enable within an organization.
However, organizational charts had also begun to show their age in the post-internet era. A simple hierarchical drawing hanging on the wall behind a manager’s desk does precious little to enable productivity all on its own.
Thanks to cloud-based tools, organizational charts can finally be implemented by having each layer mapped and all the associated processes documented. The methods and tools given above are best used as a starting point to create a first draft that can be perpetually worked on to enable better capabilities regardless of the challenges that a company faces.
If you’re not sure where to begin, start by understanding the processes your company is currently using. SweetProcess is the perfect tool to help you gain clarity over your organization’s shape, size, and goals.
These insights will prove invaluable for not only creating your company’s organizational chart, but also for refining it as well.
To help you further, we’ve put together a checklist on how to create your first organizational chart.
Download your checklist here:
Check out SweetProcess’ 14-day free trial here.

